
A data-driven1 segmentation of the European mid-market and the case for the core.
The following article is based on Pemberton’s understanding of the market at the time of publishing.
Introduction
Our previous Viewpoint, Structural drivers and recent market events create a compelling relative value opportunity in European private credit, made the data-driven case for Europe: bank retrenchment, an underpenetrated market serving an economy of comparable scale to the US and a growing private equity pipeline. This paper turns to the question that follows naturally from it: where within the European market is that opportunity most attractive?
Europe’s private debt market, worth roughly $550 billion2 (around a third the size of the US), continues to broaden as rising private equity activity, including primary buyouts and buy-and-build models, generates growing demand for debt capital from direct lenders.
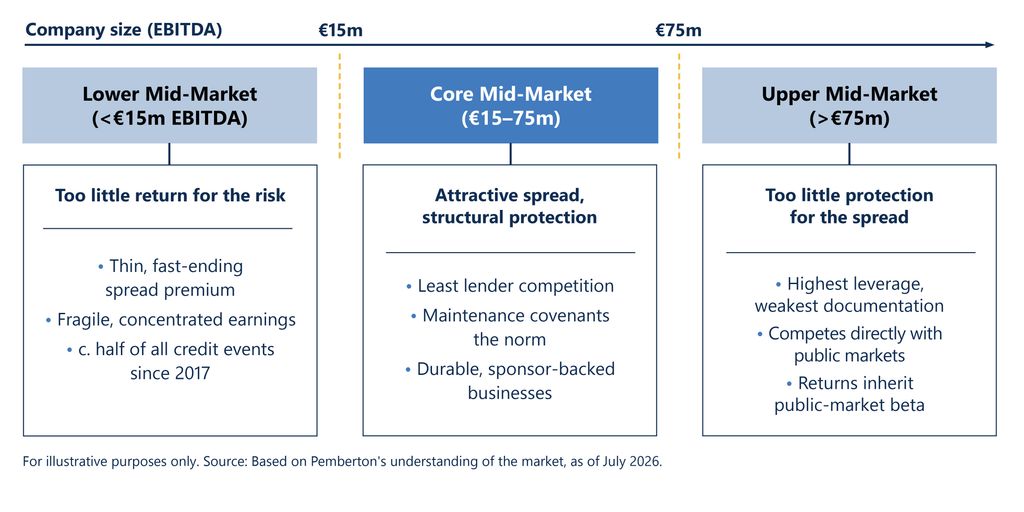
But it is not one market. Increasingly, Europe’s middle market is divided into three segments with EBITDA levels defining whether a company is positioned in the lower, core or upper mid-market. In the absence of a universal taxonomy, and for the purpose of this analysis, we define the segments as follows: the lower mid-market (companies below €15m EBITDA), the core mid-market (companies with EBITDA ranging from €15m to €75m) and the upper mid-market and large-cap segment (above €75m in EBITDA).
This paper examines the characteristics of each segment and argues that the core mid-market is the structural sweet spot. The lower mid-market generally offers a relatively thin and fast-compressing spread premium in exchange for materially higher idiosyncratic and default risk. The upper mid-market trades away spread and covenant protection for scale and liquidity, leaving returns increasingly correlated with public markets, which by contrast are liquid.
The core faces lower competition as banks have largely retreated from the middle. Large private credit managers, needing to deploy at scale, have gravitated to the upper mid-market and large-cap segment. For the direct lenders that remain, benefits of the core mid-market include pricing power, bespoke structures and structural protection through maintenance covenants and other protections limiting the ability of borrowers to raise additional debt, sell assets and pay dividends.
1. Defining the European Mid-Market
There is no universal taxonomy of the European mid-market. Statistical frameworks are built on headcount and turnover. For example, the EU’s SME ceiling sits at 250 employees and €50m of revenue, its “mid-cap” band runs from 250 to 1,500 employees, and a new “small mid-cap” tier was introduced in 2025.3 Credit markets segment differently: by EBITDA, because that is what leverage, pricing and structure are negotiated against. We therefore segment by EBITDA, with boundaries reflecting the different dynamics of the underlying market: the lower mid-market includes companies with EBITDA up to €15m, the core from €15m to €75m and upper above €75m. Figure 1 bridges those EBITDA bands to more familiar measures of company size.
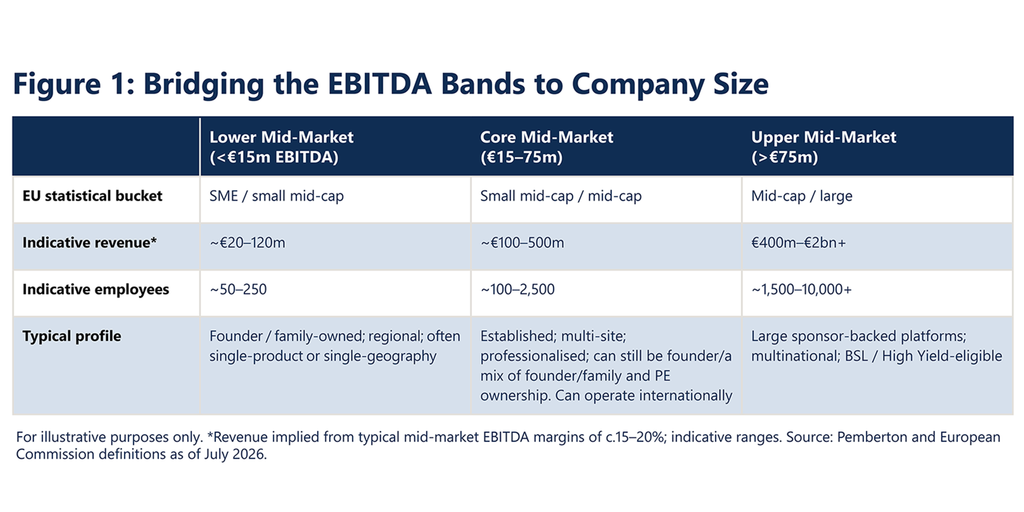
One feature stands out: the edges blur. Upper-mid-market revenues overlap the bottom of large-cap, while lower-mid-market headcounts overlap the SME ceiling. We believe the core is the most coherent, self-contained segment of the three.
2. Three Segments, Three Very Different Markets
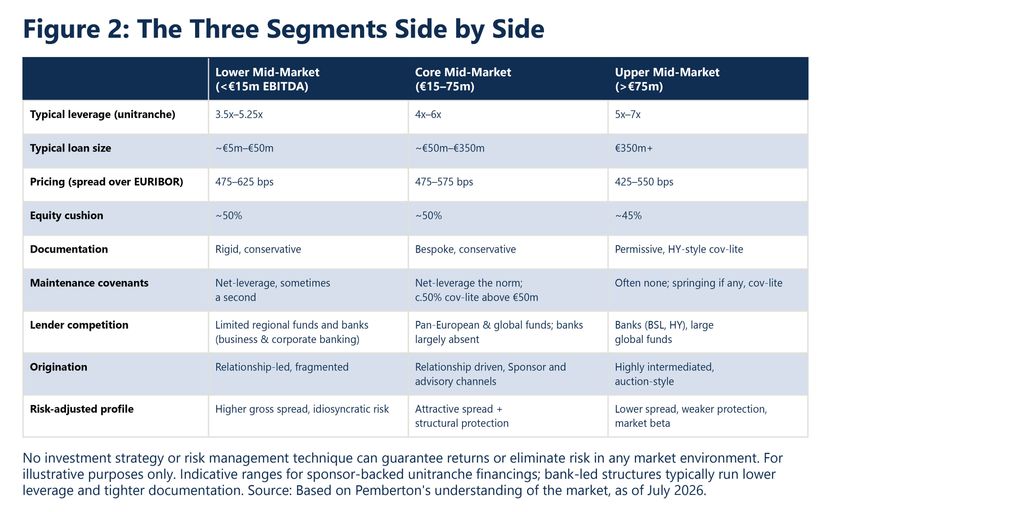
Each segment has its own borrowers, lenders, structures and origination dynamics. The differences are not marginal. They compound into materially different risk-adjusted return profiles, summarised in the bottom row of Figure 2.
Segment characteristics (in brief)
- Lower mid-market. Predominantly founder and family-owned, regional businesses, often concentrated in a single product or geography, financed by a sole lender or a small club of regional funds against rigid, bank-style documentation. The headline spread is the highest of the three segments but it compensates for idiosyncratic, concentration-driven risk rather than delivering a structurally superior return.
- Core mid-market. Established, multi-site, professionalised platforms. A mix of family/founder and private equity ownership and often international. Financed mainly by sole-lender or small-club unitranche on bespoke but conservative terms, typically with a net-leverage maintenance covenant. Competition comes from pan-European and global debt Banks are largely absent. The result is an attractive risk-adjusted spread paired with genuine structural protection.
- Upper mid-market and large-cap. Large, sponsor-backed, multinational platforms financed through syndicated unitranche, broadly syndicated loans or high yield, on permissive, HY-style cov-lite documentation with limited cash-leakage protection and often no maintenance covenants at all. With public markets competing directly for the same assets, spreads in this segment are the tightest of the three and returns carry market beta.
3. The Case for the Core
3.1 Lower Competition Helps Drive LP Value
The case for the core is driven in part by lower levels of competition, with several factors acting as drivers.
For banks, the retreat from the core is predominantly the result of regulation. Holding sub-investment-grade corporate exposure, the B/BB territory in which leveraged mid-market lending sits, is punitive under Basel III and IV capital rules, the same retrenchment dynamic documented in our previous Viewpoint, seen here at segment level. Lending at the lower end, by contrast, is treated more favourably: the EU’s SME Supporting Factor reduces capital requirements by roughly a quarter on exposures to companies with turnover below €50m, an incentive reinforced by public-mandate banks and state guarantee schemes across Europe’s national markets.4
At the other end, the largest direct lending funds, needing to deploy at scale, have gravitated towards €400m+ financings in the upper mid-market, while European funds focused on the core mid-market seeking the benefits of sole- or majority-lender positions tend to cap single transactions at around €300m. The consequence is a narrow field. European direct lending is already a concentrated market with the top five lenders accounting for 47% of loans by count5 and within the core, where banks cannot compete economically and the largest funds less focused, the number of lenders able to lead a €50–300m financing is smaller still.
For LPs, that scarcity of competition converts directly into value. It underpins pricing power that supports spread, provides the latitude to structure bespoke deals and enables better protections, including maintenance covenants. And it extends beyond terms: a sole or majority lender negotiating directly with a company typically has better access to management and information. These advantages enable better control and early intervention when a credit needs attention.
3.2 Covenants That Hold And Why They Matter
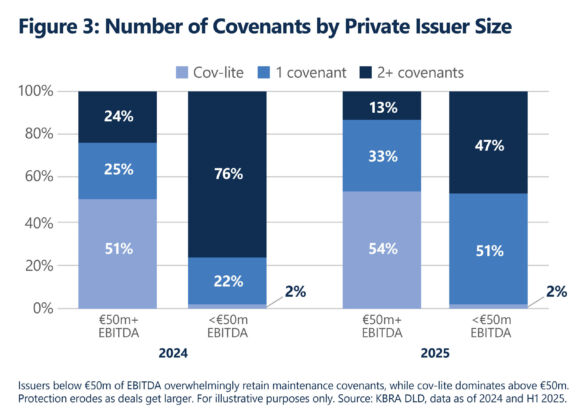
Covenant protection is real, but it is concentrated below a clear threshold. Among issuers below €50m of EBITDA, net-leverage maintenance covenants remain the norm, with cov-lite structures a small minority. Above €50m the picture changes materially: roughly half of transactions are now cov-lite (Figure 3), and by the upper mid-market, where documentation follows broadly syndicated and high-yield conventions, cov-lite is the default. Covenant protection, in other words, erodes progressively with deal size, and the lower half of the core is where it remains most reliably intact.
Covenants are not a documentation formality. They are the mechanism by which lenders engage early, while enterprise value remains. Recovery data for direct lending by covenant status is not publicly available at scale, so the best available evidence comes from the rated, broadly syndicated loan market, where the comparison can be measured and whose cov-lite documentation the upper mid-market has adopted. We view this as a proxy for what covenant erosion should be expected to mean in direct lending. On that basis, S&P Global Ratings found that first-lien cov-lite term loans recovered on average roughly 11 percentage points less than covenanted equivalents between 2010 and 2023,6 and Moody’s data on defaults between 2023 and mid-2025 shows average first-lien recoveries of 57% on cov-lite loans against 66% on covenanted loans.7 The implication for direct lending is straightforward: in the part of the market where maintenance covenants remain the norm, that recovery differential accrues directly to LPs.
Covenant value in the data: broadly syndicated loan recoveries as a proxy for direct lending
- Cov-lite first-lien recoveries run c.11 percentage points below covenanted loans (S&P Global Ratings, rated US first-lien term loans, 2010–2023)8
- 57% vs 66%: average first-lien recoveries on cov-lite vs covenanted loans (Moody’s, defaults 2023–H1 2025)9
- In Europe’s core, roughly half of transactions above €50m of EBITDA are cov-lite; below €50m, maintenance covenants remain the norm10
3.3 Resilient, Growing And Sponsor-Backed
Core businesses are also more resilient than lower mid-market businesses and, for a lender, resilience often matters more than the pace of growth. The distinction showed clearly across 2025’s stressed environment: the enterprise values of larger sponsor-backed companies (above €30m of EBITDA) grew 5.8% over the year, while those of smaller businesses (€5–30m) declined marginally, at −0.1%.11 Over longer horizons smaller companies have exhibited slightly higher growth, as would be expected from a smaller base but credit returns are not driven by average growth. They are driven by the stability of earnings through the cycle and here scale is the key factor: broader product and customer diversification, deeper management and greater resilience to macroeconomic shocks.
There is a mechanism behind that durability. The core is increasingly owned by private-equity sponsors whose value-creation playbook, spanning internationalisation, M&A-led buy-and-build and operational and governance improvement, actively compounds the scale and diversification that protect a lender over the life of a loan ends to come from rising earnings rather than financial engineering. Exit optionality reinforces the point: mid-market companies can typically be sold to strategic acquirers or other sponsors without recourse to an IPO, and their debt can equally be refinanced with incumbent or new lenders, giving lenders multiple, less market-dependent routes to repayment.
4. The Lower Mid-Market: A Faster-Eroding Risk Premium for a Materially Higher Risk Profile
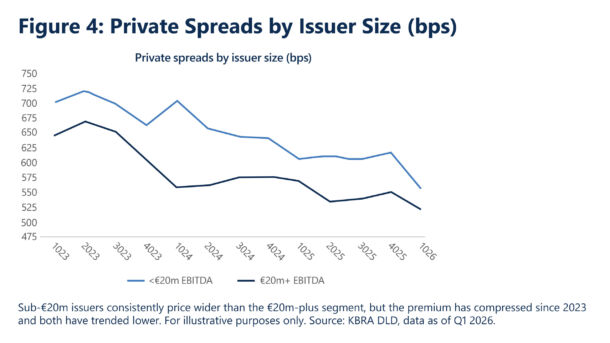
The motivation to diversify into the lower mid-market is mainly higher spread. On unitranche, that premium exists but is modest: roughly 475–625 bps versus 475–575 bps in the core, or approximately 25 bps at the midpoint, with both segments sharing the same floor. However, that spread premium is eroding fastest: in the most recent period, lower-mid-market spreads compressed by around 61 bps against roughly 30 bps for the >€20m EBITDA segment, with sterling yields falling below 10% for the first time in the dataset and euro yields continuing to trend lower.12
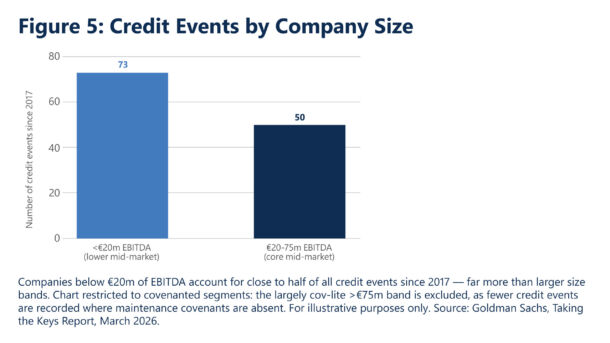
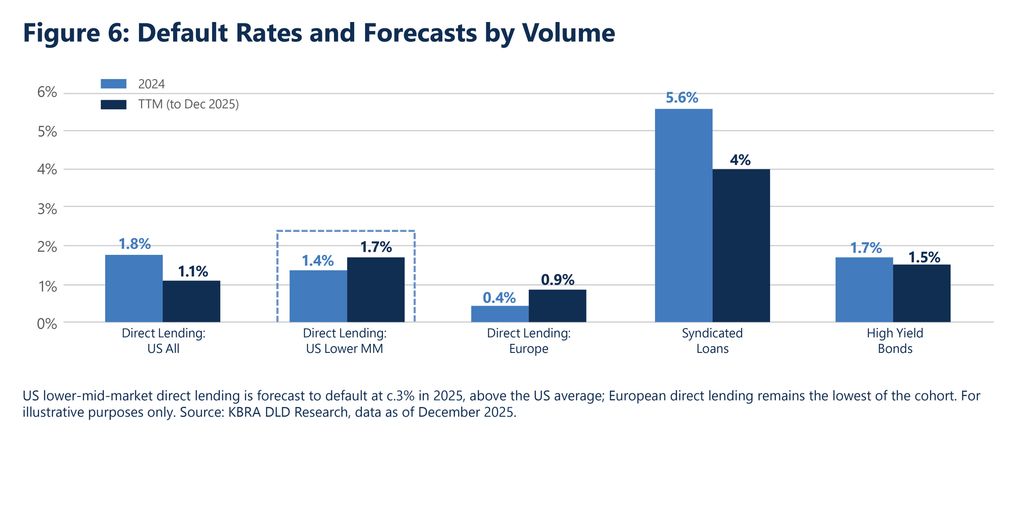
Against that shrinking premium sits a materially higher risk profile. Credit events are concentrated in smaller companies: businesses below €20m of EBITDA account for close to half of all credit events recorded since 2017 (Figure 5).13 The same pattern shows in default data: In the absence of European market data we look at the US lower mid-market loans, which carry roughly double the non-accrual rate of the broader direct lending market (Figure 6).14 Layer on single-product or single-geography concentration and the lower mid-market offers a slightly higher spread for substantially more idiosyncratic risk.
5. The Upper Mid-Market: Too Little Reward?
If the lower mid-market asks investors to take too much risk, the upper mid-market asks them to accept too little reward. Spreads are the tightest of the three segments, at roughly 425–550 bps, while scale should not be mistaken for credit quality: these remain sub-investment-grade borrowers at 5.25–7.0x, the most levered of the three segments, carrying the market’s most permissive, cov-lite documentation. The recovery differential quantified in Section 3.2 is drawn from precisely this population and is the cost of that permissiveness when credits deteriorate.
The upper end also competes directly with the public markets. As Europe’s syndicated loan and high yield markets rallied, sponsor-backed borrowers began refinancing more expensive unitranche facilities with cheaper public-market debt,15 and it is now common for larger sponsors to run both markets in parallel and take the better terms. The competition is visible in the economics: European unitranche margins have compressed to below 500 bps against a record €250bn BSL market, and the yield premium of European direct lending over the European leveraged loan index has narrowed below its historical average.16 When a segment’s assets can be refinanced into public markets at will, its returns inherit public-market beta — investors gain scale and liquidity, but forgo the illiquidity premium that is the point of private credit.
Leverage rises steadily with company size, yet risk does not follow the leverage line: it sits at both ends, where earnings are fragile, and where documentation is weakest. Credit protection rests on the durability of earnings, the diversification of the business and the covenants that let a lender act early. The core is the segment where all three tend to hold.
Conclusion
The lower mid-market offers too little return for its risk. The upper mid-market offers too little protection for its spread, and its returns increasingly track public markets. The core is where an attractive spread, genuine structural protection and durable businesses typically come together.
These conditions look set to persist. Banks are likely to continue to retrench from the core mid-market. The largest funds are pivoting to the upper mid-market, where they also compete with banks. The core’s sponsor-backed borrowers add a further, structural source of demand: because they grow through acquisition, they return to their lenders repeatedly for financing. For disciplined lenders positioned at the lower end of the core, we believe the segment offers the most attractive risk-adjusted opportunity in European private credit.
Pemberton Market Positioning
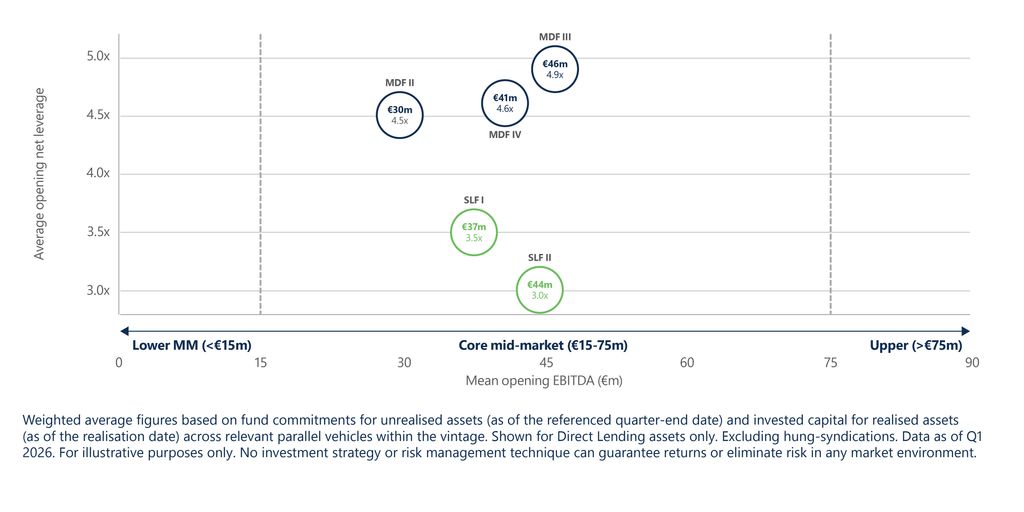
Based on average opening leverage and EBITDA Pemberton’s Senior Direct Lending portfolios (MDF & SLF) sit firmly in the core mid-market where we continue to see attractive risk-adjusted relative value.
Download Pemberton Viewpoint: Is the Core Mid-Market the Structural Sweet Spot in European Private Credit?

- 1Due to very limited data availability and inconsistent segmentation, EBITDA grouping across charts varies.
- 2Preqin, as of H1 2025.
- 3European Commission definitions: SMEs up to 250 employees and €50m turnover; statistical “mid-caps” 250–1,500 employees; a new “small mid-cap” category (up to 750 employees and €150m turnover, or a €129m balance sheet) was introduced in 2025.
- 4Article 501 CRR: capital requirements on qualifying exposures to SMEs (annual turnover up to €50m) are reduced by a factor of 0.7619 up to €2.5m of exposure and 0.85 thereafter. In the UK, a broadly equivalent SME lending adjustment applies under the PRA’s Basel 3.1 framework. Sub-investment-grade corporate and leveraged exposures carry materially higher risk weights under Basel III/IV.
- 5Houlihan Lokey, FY 2025.
- 6S&P Global Ratings, rated US first-lien term loans, 2010–September 2023 (discounted recovery basis): cov-lite first-lien term loans recovered on average c.11 percentage points less than covenanted equivalents.
- 7Moody’s Ratings, rated first-lien loans, defaults 2023–H1 2025.
- 8S&P Global Ratings, rated US first-lien term loans, 2010–September 2023 (discounted recovery basis): cov-lite first-lien term loans recovered on average c.11 percentage points less than covenanted equivalents.
- 9Moody’s Ratings, rated first-lien loans, defaults 2023–H1 2025.
- 10KBRA DLD, data as of 2024 and H1 2025.
- 11Lincoln International, European Private Market Index, Q4 2025. Enterprise-value growth in local currency; small and large defined as EBITDA of €5–30m and >€30m respectively; the larger bucket blends the core and upper segments. Since inception, smaller companies have exhibited faster EV growth (CAGR of 10.2% vs 8.7%); the 2025 differential reflects resilience under macroeconomic stress.
- 12KBRA DLD Research. First-lien term loans only; unitranche defined as leverage above 4.0x for an all-senior structure; lower mid-market defined as <€20m EBITDA.
- 13Credit-event data: Debtwire, KBRA, Octus, 9fin, LCD (credit events since 2017). The comparison is restricted to size bands where maintenance covenants are standard; the largely cov-lite segment above €75m of EBITDA is excluded, as fewer credit events are recorded by definition where covenants are absent.
- 14KBRA DLD, Lower Middle Market Index, April 2025: non-accruals of 3.2% on a cost basis versus 1.6% for the broader direct lending index. US data used as a directional proxy for Europe.
- 15White & Case / Debtwire, European Leveraged Finance reports 2025–2026: European borrowers including Phenna Group, Deutsche Fachpflege and Neopharmed Gentili refinanced unitranche facilities with cheaper BSL or high-yield alternatives. The same dynamic is measurable at scale in the US, where c.$7.3bn of direct lending debt was refinanced into syndicated loans in Q1 2025 at average spread savings of c.263 bps (PitchBook/LCD).
- 16DC Advisory, European Debt Market Monitor, Q4 2025: record institutional BSL volumes of €250bn in 2025, with competition among direct lenders, banks and the BSL market compressing unitranche pricing and fees. Lincoln International, European Senior Debt Index, Q1 2025: yield premium of European direct lending (ESDI) over the Morningstar ELLI of 2.8%, below its historical average of 3.1%.
Disclaimer:
This document is intended only for the person to whom it has been delivered and is solely for information purposes. No offer of or invitation to subscribe for interests in any fund is being made by the circulation of this document or can be implied. Any third-party information (including any valuations, statements of opinion and/or belief) contained herein is provided by Pemberton Asset Management group of companies, being. Pemberton Asset Management S.A., Pemberton Capital Advisors LLP and any other affiliates (“we”, “our” or “us”) and has not been independently verified. Statements of opinion, market or performance information and any forecasts or estimates contained in this document are prepared on the basis of assumptions and conclusions reached and are believed to be reasonable by us at the time.
No representation, warranty, assurance or undertaking (express or implied) is given (and can therefore not be relied upon as such), and no responsibility or liability is or will be accepted by us or any of our affiliates or our respective officers, employees or agents as to the adequacy, accuracy, completeness or reasonableness of the information, statements and opinions expressed in this document. Any opinions expressed in this document do not constitute legal, tax or investment advice and can therefore not be relied upon as such. Please consult your own legal or tax advisor concerning such matters. The information contained in this document (which does not purport to be comprehensive) is believed to be accurate only at the date of this document and does not imply that the information herein is correct at any time subsequent to the date hereof and such information is subject to change at any time without notice.
The views expressed herein are subject to change based on market and other conditions and we give no undertaking to update the information, to reflect actual events, circumstances or changes in expectations or to provide additional information after its distribution, even in the event that the information becomes materially inaccurate. The recipient acknowledges and agrees that no person has, nor is held out as having, any authority to give any statement, warranty, representation, assurance or undertaking on behalf of a fund, its general partner, Pemberton Asset Management S.A. or Pemberton Capital Advisors LLP in connection with any potential investment.
No part of this document may be reproduced in any manner without our written permission.
This document has been prepared and issued for use in the UK and all countries outside of the European Union by Pemberton Capital Advisors LLP. Pemberton Capital Advisors LLP is authorised and regulated by the Financial Conduct Authority (“FCA”) and entered on the FCA Register with the firm reference number 561640 and is registered in England and Wales at 5 Howick Place, London SW1P 1WG, United Kingdom. Registered with the US. Securities and Exchange Commission as an investment adviser under the U.S. Investment Advisers Act of 1940 with CRD No. 282621 and SEC File No. 801-107757. Tel: +44(0) 207 993 9300.
This document has been prepared and issued for use in the European Union by Pemberton Asset Management S.A.. Pemberton Asset Management S.A. is authorised and regulated by the Commission de Surveillance du Secteur Financier (“CSSF”) and entered on the CSSF Register with the firm reference numbers A1013 & A1342 and is registered in Grand Duchy of Luxembourg at 70 route d’Esch, L 1470. Pemberton reports to the US. Securities and Exchange Commission as a reporting exempt investment adviser under the U.S. Investment Advisers Act of 1940 with CRD 282865 and SEC File No. 802-107832. Tel: +352 26468360
This material is being distributed/issued in the Middle East by Pemberton Capital Advisors LLP (DIFC Branch) (“PCA DIFC”). PCA DIFC is regulated by the Dubai Financial Services Authority (“DFSA”). This document is intended only for Professional Clients or Market Counterparties as defined by the DFSA and no other person should act upon it.
